FlowProxy: Approaching Optimality
Our second collaboration with Flashbots on FlowProxy, featuring network analysis of bundle losses and latencies, plus transport layer optimizations for BuilderNet.
Background
In Introducing FlowProxy, Chainbound collaborated with Flashbots to deprecate its original orderflow proxy implementation in Go in favor of a new one built in Rust, created with the goal of reducing end-to-end latency, improving efficiency, and increasing observability in BuilderNet's networking layer. This first collaboration aimed at bringing it to production-ready quality and ready for deployment, already observing good improvements in networking and processing latency.
This second collaboration expanded on the Next Steps section outlined in the previous report, with success. It includes a quantitative analysis of order losses and latencies across BuilderNet, and extensive work to improve the transport layer to reduce both CPU and memory usage. We encountered a couple of non-obvious learnings that we outline below, and we hope this will be useful to the community.
Network Analysis
FlowProxy features a Clickhouse integration which makes possible to record bundle receipts. A bundle receipt consists of a short summary that includes the timestamp of when the bundle was sent and received by instances, along with its raw size in bytes (useful for tracking size → latency correlation). We used this data to better understand FlowProxy’s network performance in its entirety, and to discover what improvements to focus on.
Bundle Loss
We started with analyzing bundle loss between instances. The table below reports the percentage of bundle loss on individual links, during a small time range of congestion:
| src | dst | lost | total | loss_rate_pct |
|---|---|---|---|---|
| beaver_eastus_07 | nethermind_we_08 | 7857 | 35848 | 21.92% |
| beaver_eastus_07 | flashbots_we_09 | 1969 | 96597 | 2.04% |
| beaver_eastus_07 | beaver_we_08 | 1354 | 94000 | 1.44% |
| beaver_eastus_07 | flashbots_eastus_10 | 2 | 140801 | 0.00% |
| beaver_eastus_07 | nethermind_eastus_07 | 1 | 141534 | 0.00% |
| nethermind_eastus_07 | flashbots_eastus_10 | 10 | 35315 | 0.03% |
| nethermind_eastus_07 | beaver_eastus_07 | 10 | 35377 | 0.03% |
| nethermind_eastus_07 | flashbots_we_09 | 6 | 34560 | 0.02% |
| nethermind_eastus_07 | beaver_we_08 | 6 | 35216 | 0.02% |
| nethermind_eastus_07 | nethermind_we_08 | 4 | 34490 | 0.01% |
| flashbots_eastus_10 | beaver_we_08 | 4 | 34877 | 0.01% |
| flashbots_eastus_10 | flashbots_we_09 | 4 | 34266 | 0.01% |
| flashbots_eastus_10 | nethermind_we_08 | 3 | 34156 | 0.01% |
| flashbots_eastus_10 | beaver_eastus_07 | 1 | 35054 | 0.00% |
Or visualized:
This map represents a simplified view of the BuilderNet topology, it's not geographically accurate.
We can see in particular that inter-continental links are mostly affected by
bundle loss, especially the instance beaver_eastus_07 which receives the most
flow in that region.
The main reason bundles are marked as “lost” is when they time out, or when buffers overflow and backpressure is applied. This confirms what we explored in the last post: that HTTP/1.1 and its incapacity to multiplex requests makes it highly inadequate to deal with BuilderNet’s workload.
Latency
From the table below we can see latency between individual BuilderNet links during high congestion.
| src | dst | p50_ms | p99_ms | corr_payload_size | observations |
|---|---|---|---|---|---|
| beaver_eastus_07 | nethermind_we_08 | 39.619 | 1947.045 | -0.06 | 27991 |
| beaver_eastus_07 | flashbots_we_09 | 38.022 | 1789.051 | -0.06 | 94628 |
| beaver_eastus_07 | beaver_we_08 | 39.440 | 1521.599 | -0.04 | 92646 |
| beaver_eastus_07 | nethermind_eastus_07 | 62.639 | 292.451 | -0.02 | 141533 |
| nethermind_eastus_07 | beaver_we_08 | 33.381 | 194.660 | 0.59 | 35210 |
| nethermind_eastus_07 | nethermind_we_08 | 31.541 | 193.107 | 0.58 | 34486 |
| nethermind_eastus_07 | flashbots_we_09 | 30.992 | 192.134 | 0.60 | 34554 |
| nethermind_eastus_07 | flashbots_eastus_10 | -0.662 | 58.648 | 0.06 | 35305 |
| nethermind_eastus_07 | beaver_eastus_07 | -4.514 | 49.629 | 0.02 | 35367 |
| flashbots_eastus_10 | beaver_we_08 | 40.197 | 201.535 | 0.60 | 34873 |
| flashbots_eastus_10 | nethermind_we_08 | 38.467 | 200.267 | 0.59 | 34153 |
| flashbots_eastus_10 | flashbots_we_09 | 37.945 | 199.814 | 0.61 | 34262 |
| flashbots_eastus_10 | beaver_eastus_07 | 2.506 | 56.186 | 0.02 | 35053 |
| flashbots_eastus_10 | nethermind_eastus_07 | -7.746 | 26.184 | 0.04 | 35048 |
The negative p50 latencies here are due to clock drift.
Or, with P99 latencies visualized:
As with the previous table, we can see the highest latency between the most
active inter-region links, peaking at nearly 2s in p99. Another interesting
result is the correlation with payload size (corr_payload_size): in normal
working conditions (low p99s), it is more pronounced. This could mean a couple
of things that will be useful to know later:
- We’re not able to send large payloads in a single transmission (related to BDP, which we’ll talk about below).
- Preparing the order for transmission, or processing the order on the receiver side, takes a noticeably longer time the bigger the message. Some correlation is expected here, but it should be minimal. The main processing steps in the hot path here are JSON encoding / decoding, and signing / signature verification.
Improvements
Thread modelling
FlowProxy runs with the Tokio asynchronous runtime. The initial implementation of the proxy indiscriminately used Tokio tasks for all different kind of workloads, including CPU intensive operations like signature recovery, signing and decoding transactions. This approach is not ideal because the runtime and its tasks are fundamentally optimized for non-blocking, I/O-bound work, and using it for other blocking or CPU-bound work will increase tail latencies.
Tokio schedules many lightweight tasks onto a small number of OS threads. If a task performs CPU-heavy or blocking work, it can monopolise a worker thread, preventing other tasks from making progress. We suspected this could partly be causing some of the high tail latencies we were seeing.
The Tokio authors recommend using
tokio::task::spawn_blocking,
which we tried initially. This will spawn (or reuse) a thread managed by the
runtime that is purely used for CPU-bound and blocking operations. However, this
resulted in many more threads being spawned than we knew was necessary, and also
had more overhead than expected. We didn’t dive into this too much, but
intuitively it seemed like the blocking thread scheduler was not reusing threads
effectively (Github issue).
To mitigate this, we introduced a configurable pool of specialised rayon threads for compute-heavy operations, and tweaked the number of Tokio worker threads to match production environment requirements. This setup allows also to have a healthy environment where we can control how much resources a certain service is using, since the same machine would also run other processes like the block builder.
Side Note
While experimenting with the parameters, we observed how moving some specific compute-heavy operations resulted in a worse order processing latency. An interesting learning was that on a busy machine with many threads, sending tasks off to a different thread than the currently executing one can increase latency significantly. The cost of scheduling a new thread (context switching, waiting) should be taken into account, and is very context dependent!
HTTP/2
HTTP/2 was designed to address various performance limitations of HTTP/1.1 while keeping the same semantics. Among various improvements, the most impactful for FlowProxy is multiplexing: with HTTP/1.1 only one request/response can be in flight per TCP connection (called head-of-line blocking), while HTTP/2 allows multiplexing multiple requests and responses over a single TCP connection, using streams.
Streams are logical, bidirectional channels within one connection. They’re managed by windows: credit-based flow control mechanisms to limit how much data can be sent on a single stream, to ensure it doesn’t starve the connection. This multiplexing allowed us to greatly reduce the number of open connections, and improve connection reuse, which we already hinted was a source of message loss.
Upgrading to HTTP/2 was the first improvement we rolled out, because of its complete backwards compatibility: communication between and towards instances running on a previous version of FlowProxy would simply fallback to HTTP/1.1.
Below, you can see how the number of failures (read: lost messages) have been essentially reduced to 0 after its deployment.
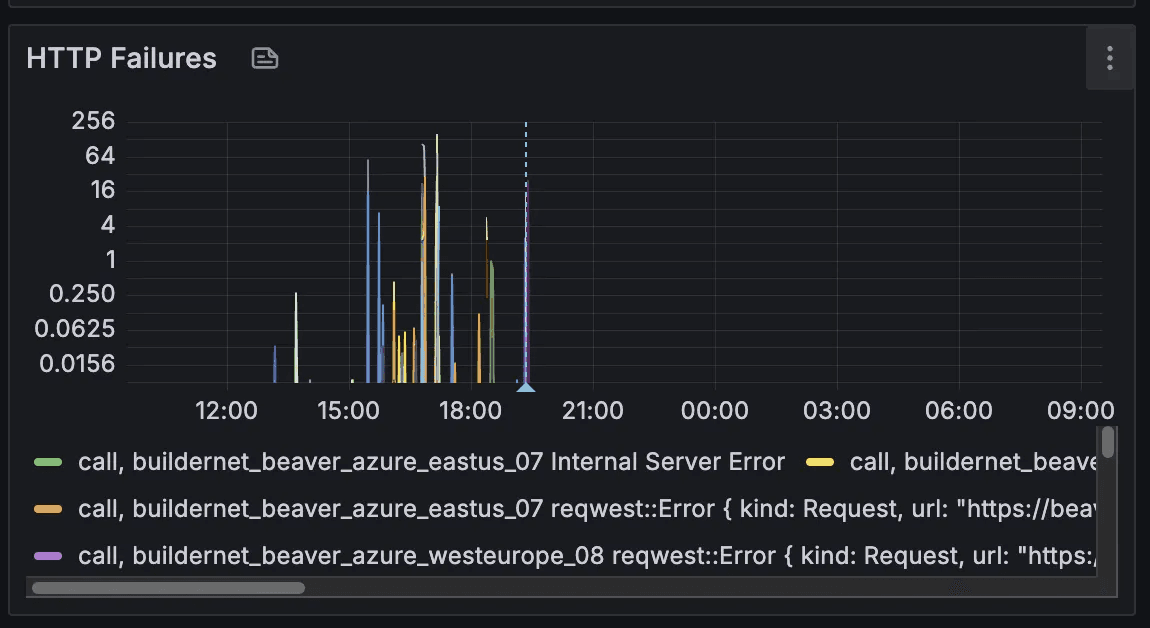
While request failures dropped, latency didn’t significantly improve. In particular, we’ve observed some improvement over small requests (with body size less than 32KiB) over inter-regional links, as we can see below. However, for same-region requests and bigger messages the situation remained identical or slightly worsened.
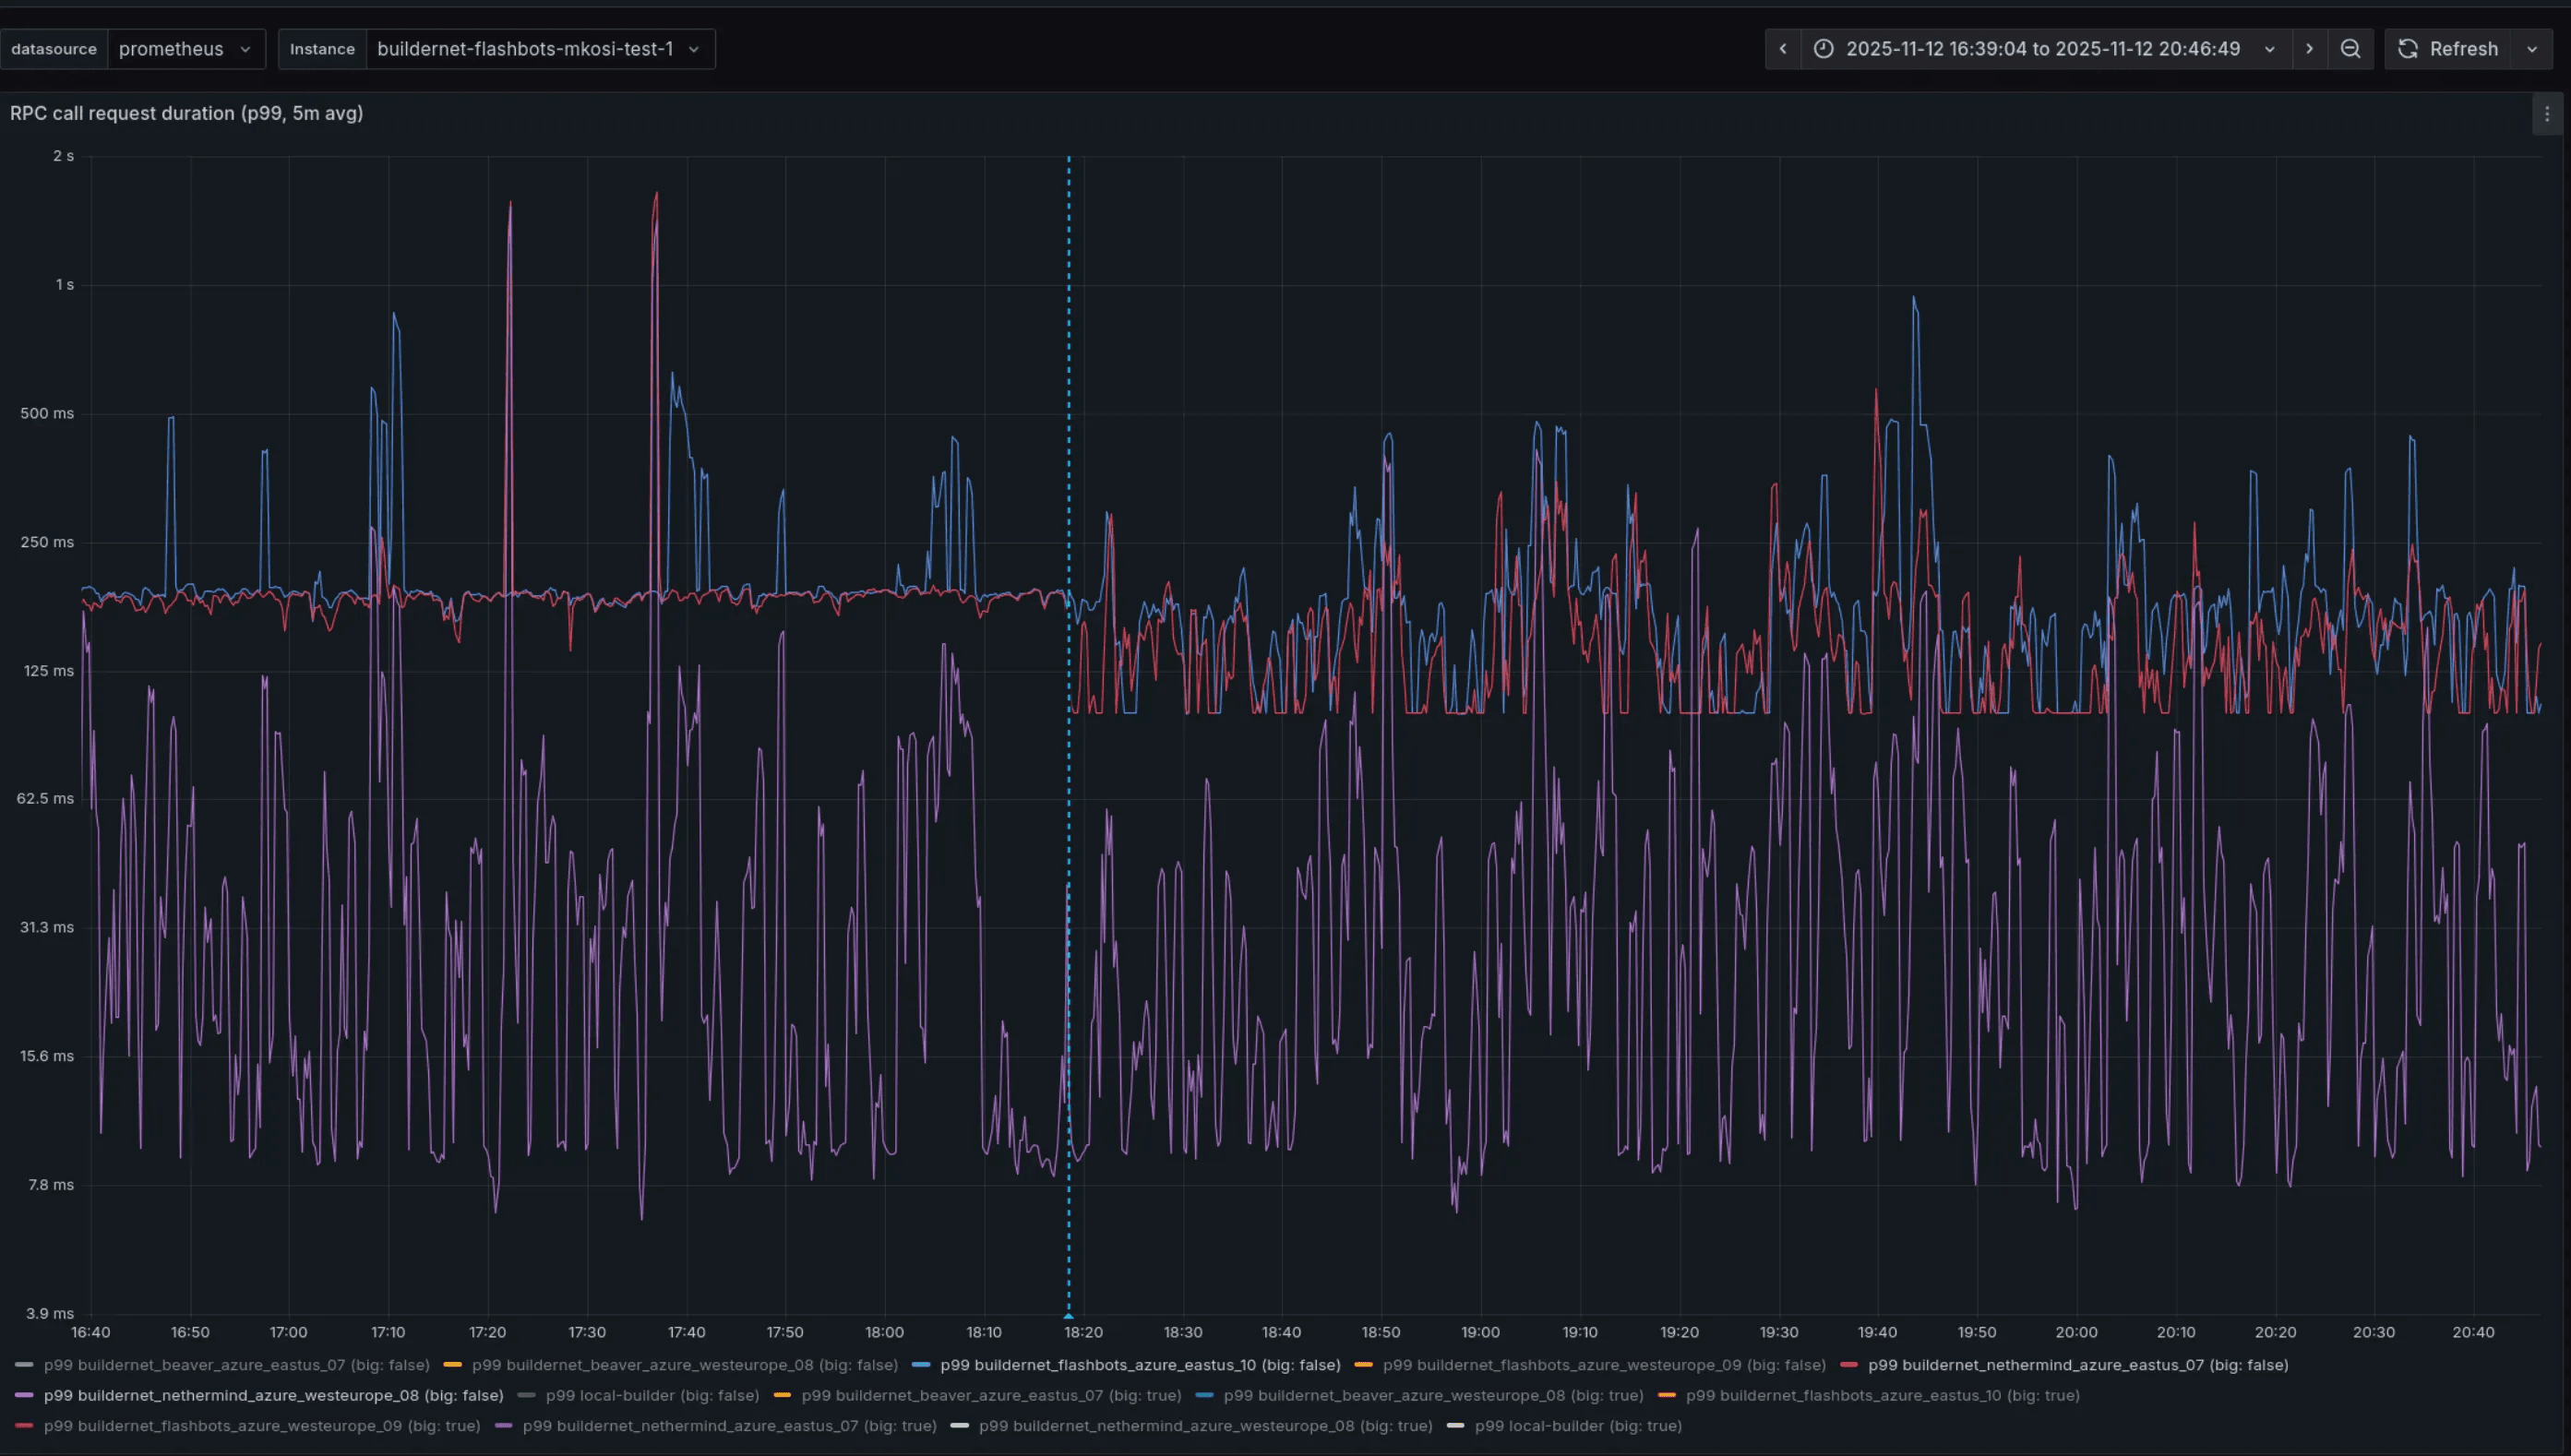
RPC call duration latency (p99) before and after the deployment of HTTP/2.
This was a very different result compared to our staging environment, consisting of four nodes distributed between East US and West Europe. We think the main culprit is an overall different topology and network load compared to the production environment, which would be hard to completely emulate. After this result, we started looking into tuning configurations.
FlowProxy instances operate with a reverse HAProxy that sits before the user and system endpoint, with the latter used for internal orderflow sharing. The proxy exposes some HTTP/2 tuning configurations that could help further reducing latency and spikiness.
The dimensions in which we could operate were:
- The number of maximum open streams;
- The size of the window buffers;
- Creating dedicated clients for small and big requests.
While tuning those resulted in marginal improvements, we were still working on high-level abstractions, without much control over the metal. Moreover, HTTP/2 windows play a similar role to TCP congestion control / window scaling, resulting in some overhead and confusion about how the two interoperate. Because of this, we decided to pause HTTP/2 tuning efforts, and focus on a full migration to raw TCP (with TLS) with the msg-rs messaging library.
Bundle loss after HTTP/2
After the deployment of this improvement, we analyzed bundle loss once again (read a full analysis here). The table below contains a day worth of data, that includes both periods of low activity and high activity. We can see that bundle loss has essentially disappeared. Sample for 2025-11-14:
| src | dst | lost | total |
|---|---|---|---|
| nethermind_eastus_07 | beaver_we_08 | 28 | 8894080 |
| beaver_eastus_07 | flashbots_eastus_10 | 8 | 3001624 |
| beaver_eastus_07 | flashbots_we_09 | 8 | 11168780 |
| beaver_eastus_07 | nethermind_eastus_07 | 8 | 30111251 |
| beaver_eastus_07 | beaver_we_08 | 8 | 10864297 |
| beaver_eastus_07 | nethermind_we_08 | 8 | 10069603 |
| nethermind_eastus_07 | flashbots_we_09 | 10 | 9028245 |
| nethermind_eastus_07 | nethermind_we_08 | 8 | 9052880 |
| nethermind_eastus_07 | beaver_eastus_07 | 6 | 10309013 |
| nethermind_eastus_07 | flashbots_eastus_10 | 5 | 10302474 |
| flashbots_eastus_10 | beaver_we_08 | 14 | 9024652 |
| flashbots_eastus_10 | nethermind_eastus_07 | 6 | 10443797 |
| flashbots_eastus_10 | beaver_eastus_07 | 6 | 10458639 |
| flashbots_eastus_10 | nethermind_we_08 | 4 | 9087691 |
| flashbots_eastus_10 | flashbots_we_09 | 2 | 9115212 |
HTTP/2 latency
Below we can see a more complete before-after of latency between links. We can see that after HTTP/2 we see more bounded p99 and p999, while p50 and p90 stayed almost the same. While picking a single day from both deployments may not be completely indicative, the behaviour remained quite consistent during the next days. Latency comparison of P99 latencies befor, each with 24 hours worth of datae and after HTTP/2 for a day's worth of data (all numbers in milliseconds):
| src | dst | p50_a | p50_b | Δp50 | p99_a | p99_b | Δp99 |
|---|---|---|---|---|---|---|---|
| nethermind_we_08 | beaver_eastus_07 | 42 | 42 | ~0 | 458 | 155 | -303 |
| nethermind_we_08 | flashbots_eastus_10 | 42 | 41 | -1 | 455 | 142 | -313 |
| beaver_eastus_07 | nethermind_we_08 | 44 | 41 | -3 | 357 | 125 | -232 |
| beaver_eastus_07 | flashbots_we_09 | 45 | 46 | +1 | 297 | 122 | -175 |
| nethermind_eastus_07 | flashbots_we_09 | 48 | 45 | -3 | 299 | 120 | -179 |
| flashbots_eastus_10 | nethermind_we_08 | 42 | 43 | +1 | 206 | 119 | -87 |
| flashbots_eastus_10 | flashbots_we_09 | 43 | 44 | +1 | 206 | 106 | -100 |
| flashbots_eastus_10 | beaver_eastus_07 | 43 | 44 | +1 | 284 | 131 | -153 |
| nethermind_eastus_07 | beaver_eastus_07 | 39 | 41 | +2 | 200 | 96 | -104 |
| beaver_eastus_07 | flashbots_eastus_10 | 40 | 41 | +1 | 197 | 103 | -94 |
TCP + bitcode
To preserve backwards compatibility, we offered a new TCP-only version of system API along with the existing HTTP/2 one. Using a new temporary endpoint allowed us to experiment with binary encoding format, so we could finally remove JSON which other than offering high decoding latency, resulted in ~50% bigger payloads than necessary due to encoding hex data as strings.
First, we tried to look into serde compatible binary encoding formats, like
bincode and MessagePack, but both of them do not have full feature
compatibility with serde_derive. Because of that, we opted out from serde
compatibility and went with
bitcode instead, which currently
sits at the top of the
Rust Serialization Benchmark
leaderboard.
This was the result of both a switch to TCP (without any additional tuning yet), and migration from JSON to bitcode:
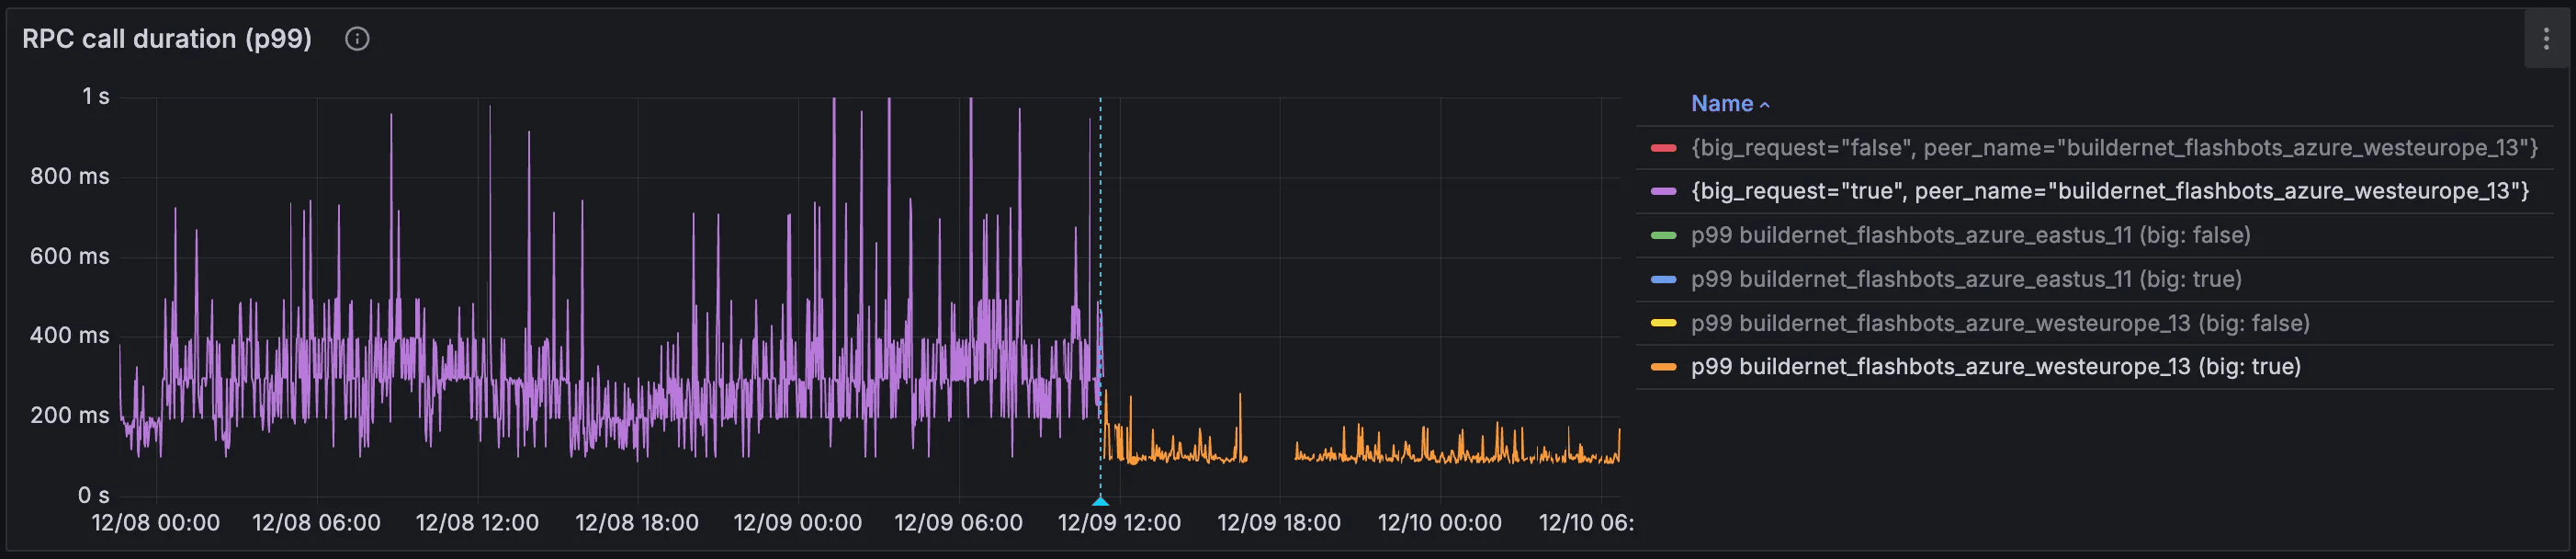
However, there’s a big caveat here: we only saw these levels of improvements on very specific links. The plot above depicts latency from a specifically broadcast-heavy instance: one that ingests and forwards a lot of orders. We barely saw any improvements on other instances, which led us down the rabbit hole of TCP kernel parameters.
Kernel Parameter Tuning
In order to get the most of raw TCP sockets, it has been fundamental to tune kernel parameters to achieve optimised connections. To understand better the changes we’ve done, let’s brush up on some preliminaries.
The bandwidth-delay product, or BDP, is a property of a network path, and is computed as the product of bandwidth, expressed in bytes per second, and round-trip time (delay), expressed in seconds. In the context of TCP, it represents how much in-flight data the connection can hold before the sender must wait for acknowledgments from the receiver.
Let’s make a concrete example: a node in FlowProxy has a upload bandwidth of 1
Gbps, and an Azure link between East US and West Europe is around 85ms
(source).
This results in a BDP of 1 Gbps × 85 ms = 85 Mbit = 10.625 MB, meaning that is
the theoretical maximum of data we can have unacknowledged in TCP, assuming
ideal network conditions.
Related to BDP is the congestion window (referred as cwnd in code). It is a
core TCP mechanism that controls how much data a sender is allowed to have “in
flight” (sent, but not yet acknowledged) at any given time. On the receiver
side, there’s rwnd (the receive window), which determines how much
unacknowledged data can accumulate at the receiver side before packets are
dropped. The minimum of cwnd and rwnd determines your maximum throughput.
One direct consequence of BDP is the following: if
min(cwnd, rwnd) < size(message), that message will need an additional round
trip to fully transmit!
By definition, the theoretical maximum size of the congestion window for communicating over a link matches the BDP. That would mean there is no congestion at all! However, the network might not be always stable, and packet loss might happen and RTT may vary over time. As such, the congestion window dynamically adapts to the appropriate amount of unacknowledged data to not waste any resources. These mechanisms are called TCP congestion control algorithms.
All of these parameters can be modified in the Linux kernel with sysctl. The
following are the most important:
net.ipv4.tcp_congestion_control: the default (cubic) worked for us.net.ipv4.tcp_window_scaling: ensure this is turned on.net.ipv4.tcp_rmem: sets the bounds forrwnd. Default and max had to be significantly increased, some multiple of your expected max message size is a good guideline. Linux will take care of autoscaling this if window scaling is turned on.
Other than congestion algorithms, there are other settings that may impact the
congestion window. One of them is called “slow start after idle”, which sysctl
setting is net.ipv4.tcp_slow_start_after_idle . A connection is considered
idle if a packet hasn’t been sent for a certain amount of time, computed as a
function of the RTT, but with a default minimum of 200ms that we would be used
in case of a 85ms RTT. In case of idleness, the congestion window is greatly
reduced, diminishing throughput and increasing latency.
Given connection between FlowProxy instances are long lived, and can be bursty in period of high-traffic, this setting should be disabled. In the picture below you can see the tremendous impact of the switch on low volume instances:
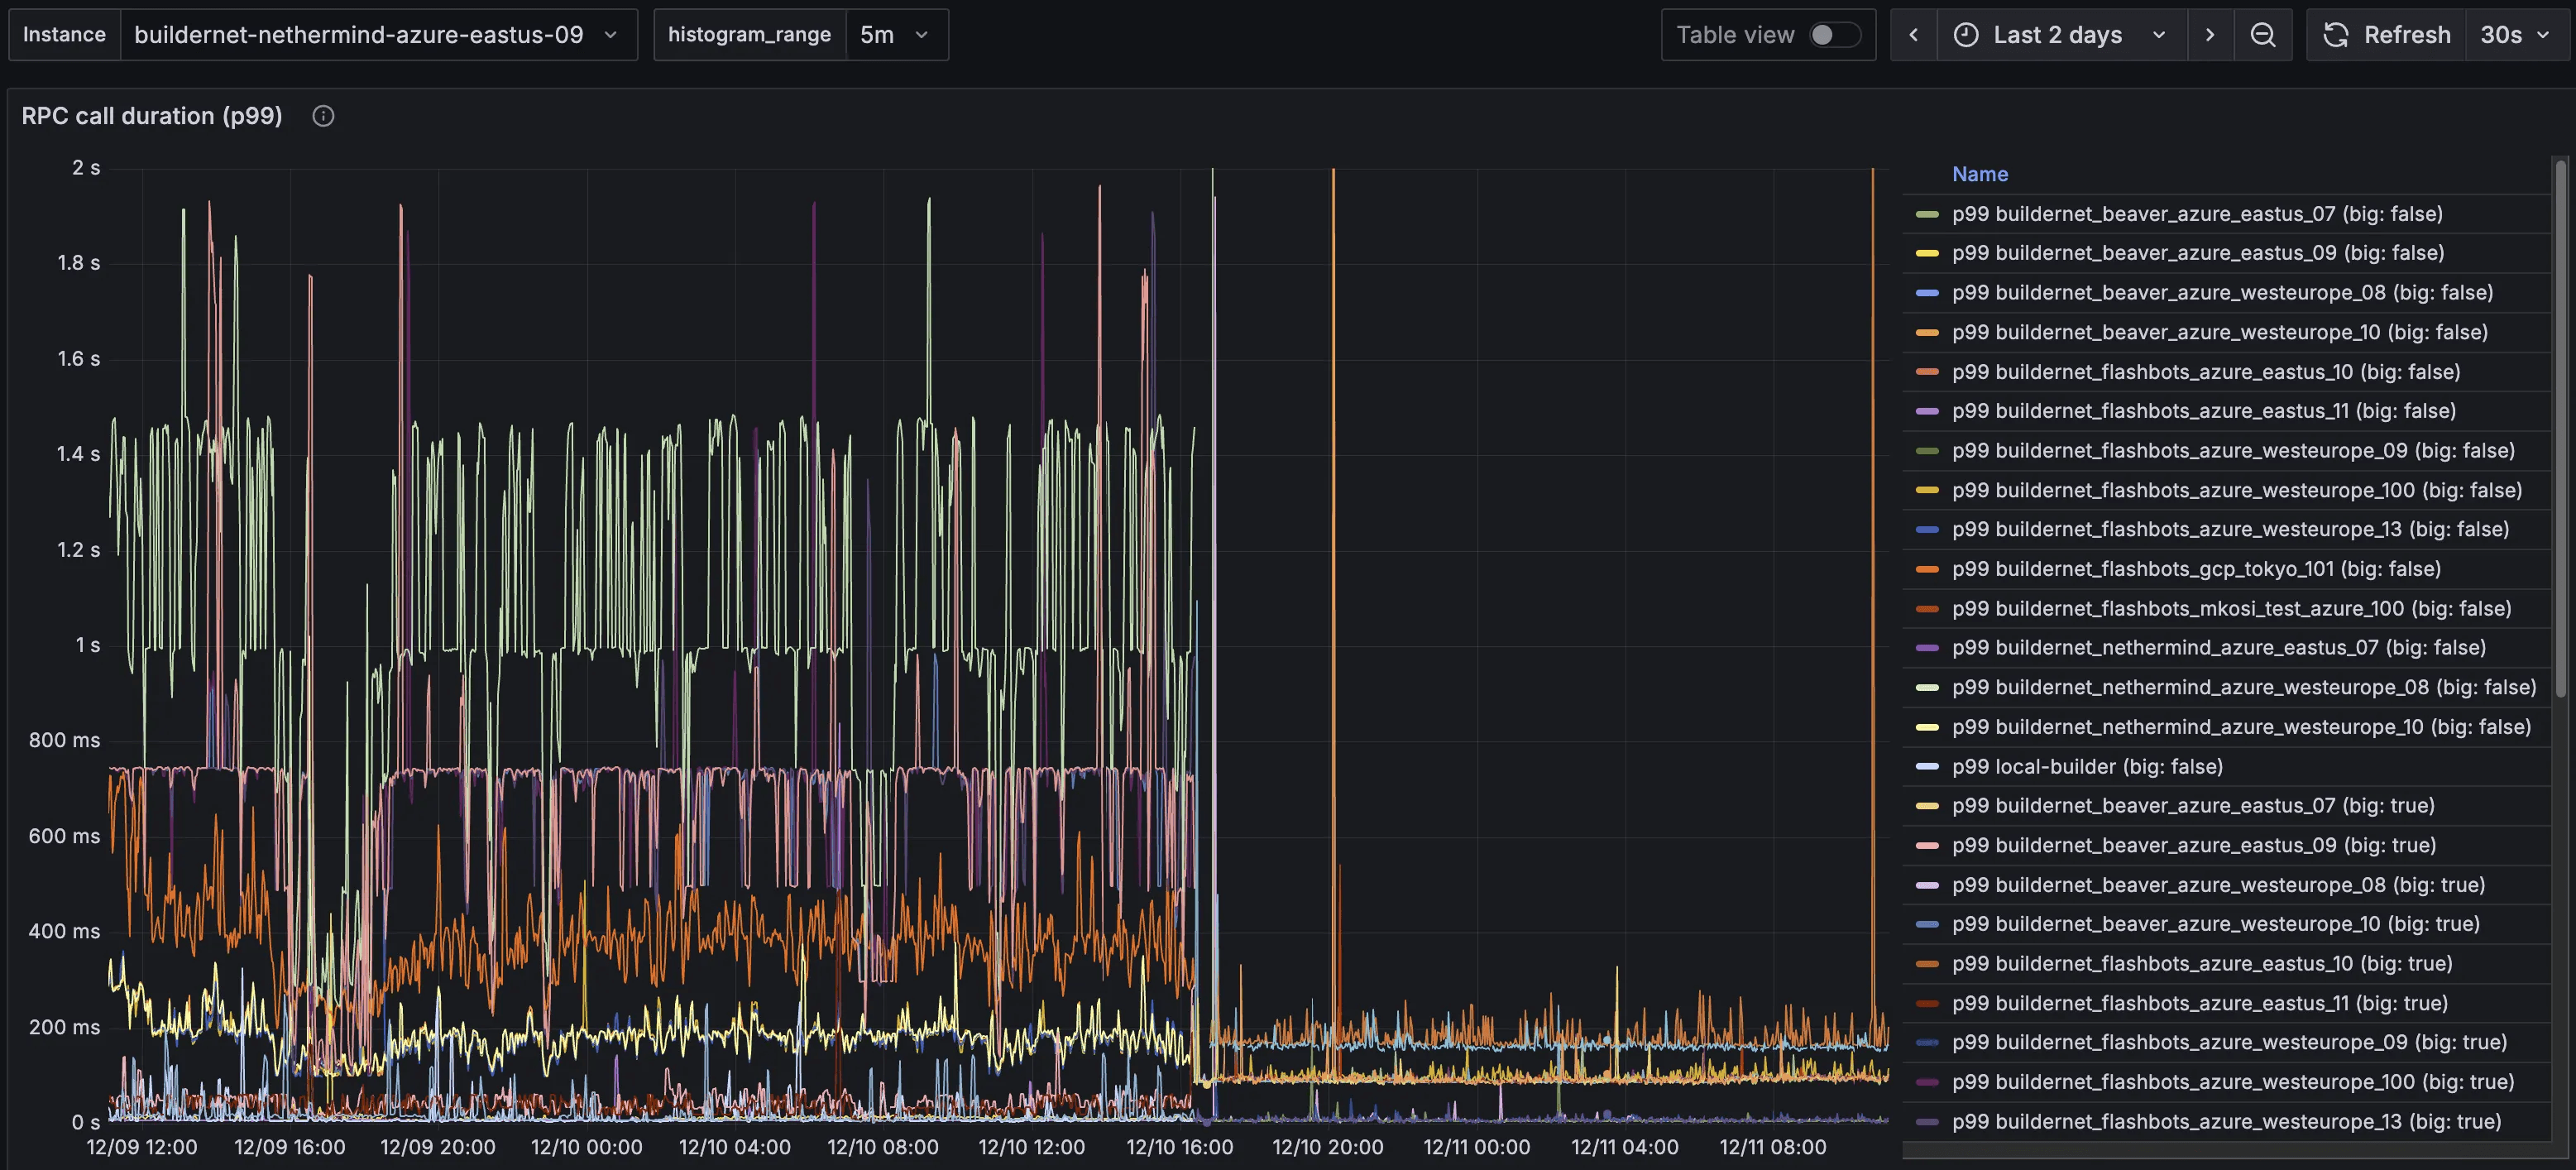
Call duration latency (p99) before and after the
net.ipv4.tcp_slow_start_after_idle has been disabled.
This setting was exactly why the high message volume instances displayed really good latency after the switch to TCP, and the others didn’t: their TCP connections were never idle, so the congestion windows were never reset.
The general takeaway here is that Linux TCP settings are very conservative and always try to save on resources, and should almost always be changed depending on your workload.
Latency Comparison
After all these modifications, we were finally approaching optimality in terms of order propagation: variance for big and small messages, over long and short links was reduced significantly. Check out the full comparison of P99 latencies below, each with 24 hours worth of data:
Before
After
There was one more change that we knew would be impactful, not on latency but on CPU usage.
mTLS
The last improvement we’ve been working on during this collaboration has been mutual TLS (mTLS). If required by the server, the client must present a valid X509 TLS certificate to authenticate itself. This works, because all instances know each other's TLS certificates through a central service registry.
Currently, FlowProxy authenticates other instances on a message-by-message basis: every message it gets needs to be signed by a known ECDSA public key. This is secure, but wasteful: every message needs to be a) signed by the sender, and b) verified by the receiver. mTLS would change authentication on a message basis, to authentication on a connection basis. Authentication would occur during connection setup, and after a successful authentication, all messages sent on that connection are transitively authenticated too.
As of December 22, 2025, this feature hasn’t been deployed yet on a production environment, but from the picture below we can already appreciate its effects on the staging environment.
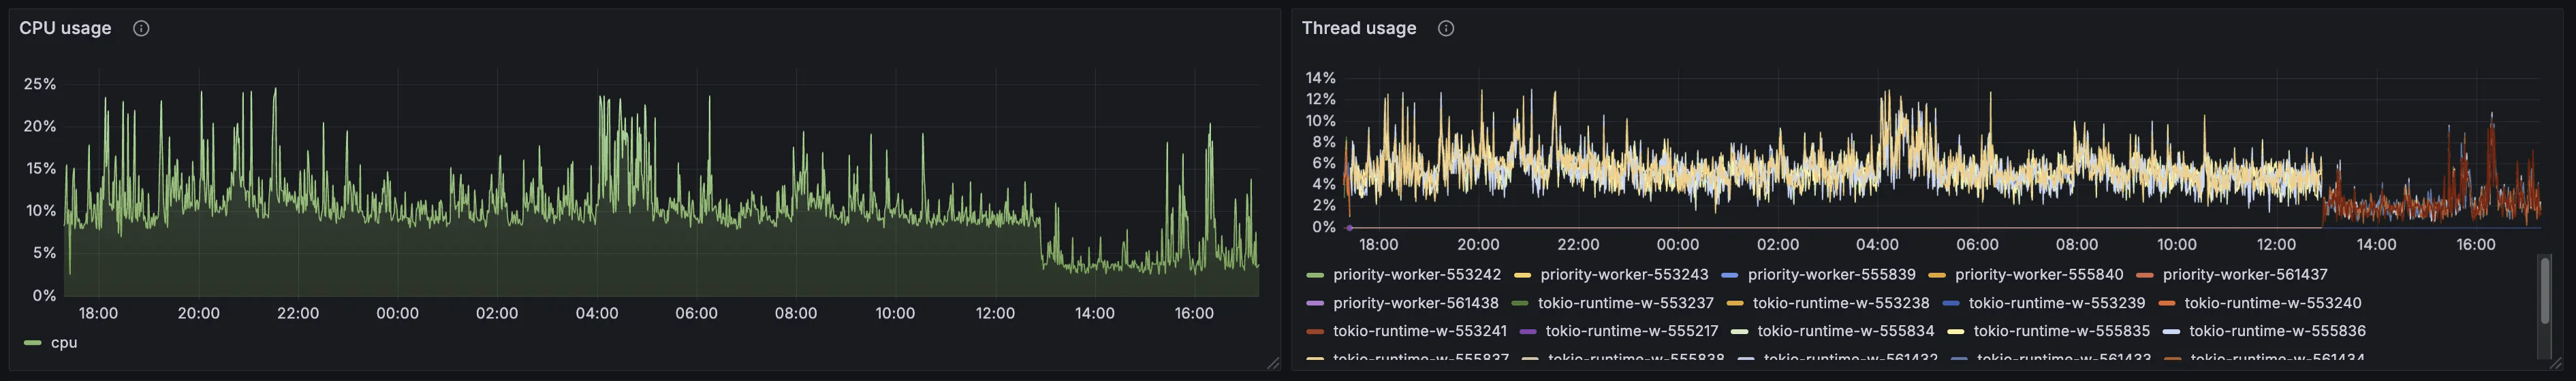
Global CPU usage and thread usage after deployment of mTLS on a staging environment.
From this preliminary result we can see a 50% reduction of CPU and thread usage, lowering total CPU usage of FlowProxy from ~10% to 5%. While this may seem like a minor improvement, freeing up CPU to be used by other critical services such as rbuilder can make the difference between winning and losing a MEV-Boost auction.
Next Steps
At the moment we’re pretty satisfied with the performance of FlowProxy, but there is still room for improvement. In particular, we haven’t yet worked on the communication between a FlowProxy instance and its local builder, which still uses JSON-RPC over HTTP, although via localhost. Assuming these two services keep running on the same machine, we could implement a shared memory based transport. While this would be clearly a benefit over the status quo, we’re coming closer to a point of diminishing returns compared to other improvements.
As such, next steps could move away from FlowProxy and concentrate over a different part of the stack of BuilderNet and its architecture.
next reads
Keep the thread going with related posts.
Introducing FlowProxy
How we collaborated with Flashbots to build a new orderflow proxy in Rust for BuilderNet, reducing E2E latency and increasing observability.
Attested TLS in the Wild
An exploration of attested TLS for fully confidential, end-to-end attested TEE communication
Vixy: Vibe-coding an Ethereum Node Proxy
An experiment in using Claude Opus 4.5 to one-shot a production-ready Ethereum EL and CL JSON-RPC proxy with automatic failover.