Block & Blob Propagation with PeerDAS
Analyzing key Ethereum network metrics to measure the impact of PeerDAS and increasing blob counts on block latency, attestation rates, and orphan rates.
TLDR; This article analyzes various key Ethereum network metrics to measure the impact of PeerDAS and increasing blob counts. These metrics include block + blob validation latency, attestation rates, and orphan rates. We find a clear correlation between higher blob counts with PeerDAS, and a negative change in said metrics (link to results summary), and argue that especially with the competitive and latency-sensitive dynamics of PBS, this may impose artificial blob limits that are below any protocol-defined limits. In response to these issues, we outline a design for a network of supernodes that we want to build to help alleviate some of them.
| Does blob count impact: | Block latency? | Attestation rate? | Orphan block rate? |
|---|---|---|---|
| Mainnet w/o PeerDAS (baseline) | Yes across the board | Yes but only for p99 | Inconclusive results |
| Mainnet w/ PeerDAS-BPO1 | Yes across the board | Yes across the board | Not enough data |
| Hoodi w/ PeerDAS-BPO2 | Yes for blob count ≥ 9 | Yes for blob count ≥ 14 | No |
Introduction
PeerDAS. Ethereum recently deployed Fusaka, an important milestone of its rollup-centric roadmap, which introduces PeerDAS as its first set of features enabling data availability sampling (DAS). The concrete goal of PeerDAS is to help the network sustain a much higher number of blobs per block. The network supported a blob (target, max) of (6, 9) before Fusaka’s deployment and is expected to support up to (48, 72) hopefully within 2026. PeerDAS heavily modifies blob mechanics; it changes how blobs are created, referenced, disseminated/custodied, and verified. PeerDAS therefore naturally raises trade-offs.
The limitations of DAS. While validators no longer have to download and verify full blobs thanks to PeerDAS, proposers do however have to perform more computation and have to upload more data. With PeerDAS, blobs are now encoded using Reed-Solomon, resulting in encoded blobs that are twice the size of pre-PeerDAS blobs (128 kB → 256 kB). The block proposer organizes the encoded blobs of a block as a 2D matrix where each blob is a row of the matrix. The matrix is split into 128 columns by the proposer who computes a KZG commitment per column and disseminates each column separately to each of the 128 sub-networks of validators. Proposers do have to compute and upload more data per block compared to before PeerDAS, mostly because of Reed-Solomon encoding. This problem will be exacerbated as more blobs are added per block with the rollout of BPOs. Some notable proposals for the future of DAS, including FullDAS and FullDASv2, are aiming for 2D encoding which further doubles the overhead due to encoding, hence further worsen the bandwidth cost for builders, proposers, and relays and its impact on dissemination latency for all validators.
Empirical analysis. This document mainly includes an analysis of the impact of blob count per block on Ethereum thanks to the observations recorded in ethPandaOps’ Xatu database. Namely, the analysis studies the impact of blob count on (1) block & blob reception latency for validators, (2) successful attestation rate by validators, and (3) the probability of a block to not be finalized and to be orphaned instead. The measurements are made on
- Mainnet pre-PeerDAS deployment to serve as a baseline with a blob count of
(6, 9) - Mainnet post-PeerDAS and BPO1 hence with a blob count of
(10, 15) - Hoodi post-PeerDAS and BPO2 with blob count of
(14, 21)
Results [summary table]. Increasing the blob count incurs a clear worsening of both block latency and attestation rate on almost all observed networks, both before and after PeerDAS alike. Additionally, we observed a worse tail latency after PeerDAS compared to before, and the tail latency increasingly worsens as the blob count increases. However, increasing the blob count has no noticeable impact on the orphan rate; some results are inconclusive and overall more data is required to have a meaningful conclusion regarding orphan rate.
Proposal: 🌱 Seeding network. Considering the results of the analysis, we propose to add a network of specialized supernodes into the Ethereum network with the goal of speeding up the propagation of blocks, blobs, and blob columns from block proposers (the relays in PBS) to the rest of the network. This added service will act like a training-wheels network, ensuring specialized actors in the PBS supply chain don’t start artificially limiting blob counts due to the risk of including them, as discussed in this presentation.
Blob Count Empirical Analysis
The impact of blobs on some of these metrics can already be observed in the Ethereum networks today. The following analysis highlights our main observations related to the number of blobs present per block and shows that there is still room for improvement after PeerDAS’ deployment.
Analysis Scope
This analysis focuses on the following questions. Does increasing the blob count impact:
- The time required for validators to receive blocks and required blob columns?
- The ability for validators to attest to blocks by the 4s deadline?
- The probability of a block to end up orphaned?
Analysis Structure
We study four combinations of networks and forks with four different blob counts:
- Mainnet under the Pectra fork with a stable network of
20,000 nodes and supporting a
(target, max)of(6, 9)blobs. This dataset serves as a pre-PeerDAS baseline. - Mainnet under the Fusaka fork with PeerDAS and BPO1 activated to support a
blob count of
(10, 15). We observed a noticeable reduction in noise after BPO1 activation so we opted to not include the data before it, i.e., the first week of Fusaka data. This dataset serves as a stable post-PeerDAS case study. - The Hoodi testnet under the Fusaka fork, with PeerDAS, run by
2,000 nodes with BPO2 activated to
support a blob count of
(14, 21). This network is less stable and smaller than Mainnet but already has BPO2 activated. As a testnet, Hoodi’s architecture is closest to Mainnet which makes it preferable to study than Sepolia. This dataset serves as a case study with PeerDAS and BPO2.
Setup
Sources: All the results are extracted from the Xatu database maintained by ethPandaOps. The exact queries used to obtain the plots are publicly accessible for reproduction in https://github.com/chainbound/blob-seeder-data.
Plots: Some plots use a box-and-whisker representation to depict the distribution of results. The boxes are classic: the ends of the boxes represent the 25th and 75th percentiles (noted p25 and p75) and the bar inside each box represents the median (p50). The following plots include two pairs of whiskers to better depict tail latency behaviors; the whiskers represent p1 and p5 on one end and p95 and p99 on the other. Outliers are half-transparent colored circles outside of the whiskers’ range. The box-and-whisker parameters are reminded in the top right corner of the plots.
Summary of Results
| Does blob count impact: | Block latency? | Attestation rate? | Orphan block rate? |
|---|---|---|---|
| Mainnet w/o PeerDAS (baseline) | Yes across the board | Yes but only for p99 | Inconclusive results |
| Mainnet w/ PeerDAS-BPO1 | Yes across the board | Yes across the board | Not enough data |
| Hoodi w/ PeerDAS-BPO2 | Yes for blob count ≥ 9 | Yes for blob count ≥ 14 | No |
- Latency: Clear impact of blob count on latency.
- When comparing latency before and after PeerDAS for blocks with the same blob count, the data shows that, even for low blob counts of 3 to 9, PeerDAS has improved validation latency for 95% of validators on Mainnet compared to Pectra but worsened it for the remaining minority. However, blocks are disseminated faster with PeerDAS than without, which indicates that the dissemination of blob data necessary for validation is actually slower for the last 5% of validators with PeerDAS than without.
- Mainnet without PeerDAS: The latency increases linearly with the number of blobs. This trend covers the entire distribution and is visible from p5 to p99 values. Additionally, p99s are at or above the 4 s deadline for all blob counts; p99 for 9 blobs is even greater than 5 s.
- Mainnet with PeerDAS-BPO1: The linearly increasing trend persists with PeerDAS and is visible across the plot from top to bottom for all values from p5 to p99. The latency is slightly improved for most nodes with PeerDAS compared to without since most p50 and p75 values are improved by 100-200 ms. However, the unluckiest 1% of validators experience worse block latency with PeerDAS since the p99 values are all worse for blob count ≥ 3. The p99 values are all greater than 5 s for blob count ≥ 9, greater than 6 s for 14 blobs, and it even reaches 12.4 s for the max blob count of 15.
- Hoodi with PeerDAS-BPO2: There is a clear increasing trend for blob count ≥ 9 values that appear mostly linear for all p1 to p99. This indicates that the trend may likely remain linearly increasing on Mainnet once BPO2 is deployed.
- Attestation rate: Clear impact of blob count on attestation rate.
- Mainnet without PeerDAS: A higher blob count increases p99 of failed attestation rate for blob count ≥ 4. The blob count barely impacts attestation rate otherwise.
- Mainnet with PeerDAS-BPO1: Failed attestation rate is overall significantly worse with PeerDAS than without. p75 before PeerDAS is stable at 0.6% across all blob counts but it increases from 0.9% to 1.8% as the blob count increases after PeerDAS. Similarly, p95 increases from 2.4% for 1 blob to 7% for 15 blobs.
- Hoodi with PeerDAS-BPO2: The failed attestation rate increases linearly with the number of blobs for blob count ≥ 14. The median rate of validators that do not attest finalized blocks goes from 4% for 14 blobs to 5% for 21 blobs, and p99 goes from 11% for 14 blobs to 37% for 21 blobs.
- Orphan block rate: Little to no impact of blob count on orphan block rate.
- Mainnet without PeerDAS: The results are inconclusive. One plot computing the orphan rate based on the total number of slots (the absolute rate) shows patterns indicating a correlation between blob count increases and orphan rate increases. However, the second plot that computes the orphan rate based on the number of finalized blocks containing the same number of blobs — i.e., the proportional rate — does not show any pattern.
- Mainnet with PeerDAS-BPO1: Orphans are rare, and there is not enough data yet.
- Hoodi with PeerDAS-BPO2: There does not appear to be a correlation between blob count and rate of orphan blocks on Hoodi. The plot showing absolute rate mostly highlights two outlier values, while the plot showing proportional rate mostly highlights the pattern seen on block latency between 6 and 13 blobs.
Mainnet Latency Comparison
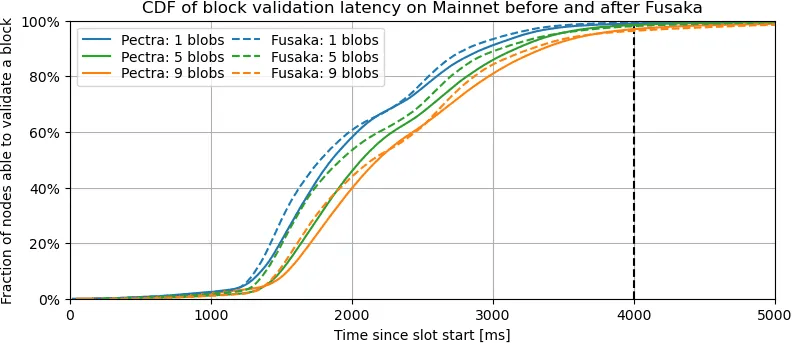
Description. This plot shows the evolution of the fraction of validators that have received enough data to validate a block on Mainnet with Pectra versus with Fusaka rules when there are 1, 5, and 9 blobs in a block. More precisely, it depicts the cumulative distribution function (CDF) for the block validation latency that we define as the earliest time at which a validator is able to validate a block according to the consensus rules. In order to validate a block, a validator in Pectra must have received the block and all its blob sidecars, while it must only receive the block and at least 8 blob columns, including all the blob columns it must custody, under Fusaka rules. The details of the Pectra and Fusaka datasets — Mainnet before PeerDAS and Mainnet with PeerDAS-BPO1, respectively — are explained further in the description of their respective latency plots.
Takeaways. All three pairs of lines, when paired by blob count, exhibit a similar pattern: most validators can verify blocks earlier in Fusaka compared to Pectra, i.e., the dashed line is mostly above the solid line. Additionally, adding blobs in a block naturally adds latency. We observe a slight slump in the dissemination around 2.3-2.5 s that may be due to cross-continental latencies between dense clusters of validators.
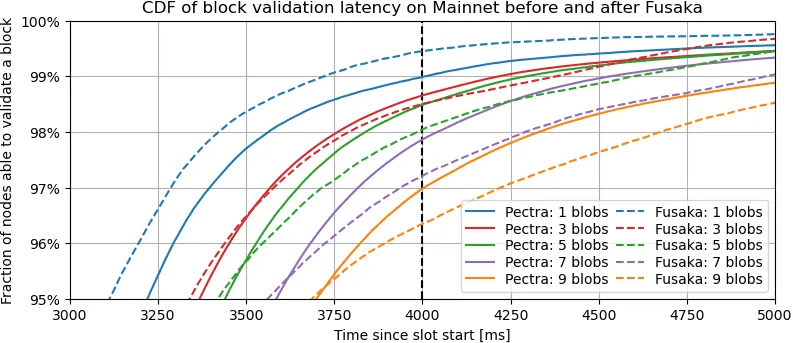
Description. This plot is a zoomed version of the above plot, with lines for 3 and 7 blobs added, to highlight the beginning of the tail of the disseminations, past p95.
Takeaways. The behavior of the pair of lines for 1 blob remains consistent with the above plot: more than 99% of the validators are able to verify blocks faster under Fusaka than under Pectra when the blob count is that low. However, the behavior is reversed for higher blob counts: the unluckiest 4-5% validators actually require more time to receive the validation data with Fusaka than with Pectra. The trend worsens as the blob count increases as shown by the gap between the solid and dashed lines of the same color. These two plots show that PeerDAS has improved latency for 95% of the validators but worsened latency for the remaining minority.
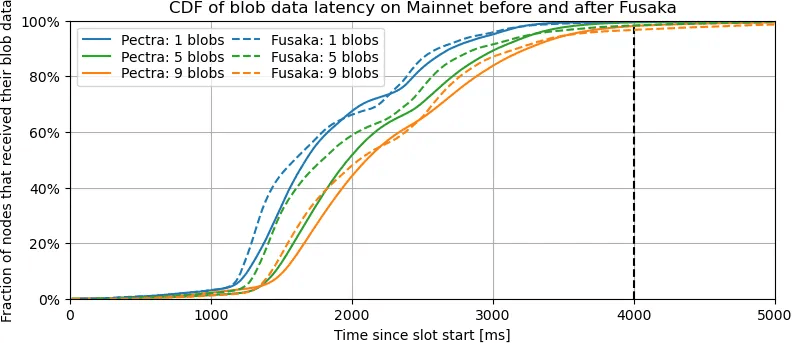
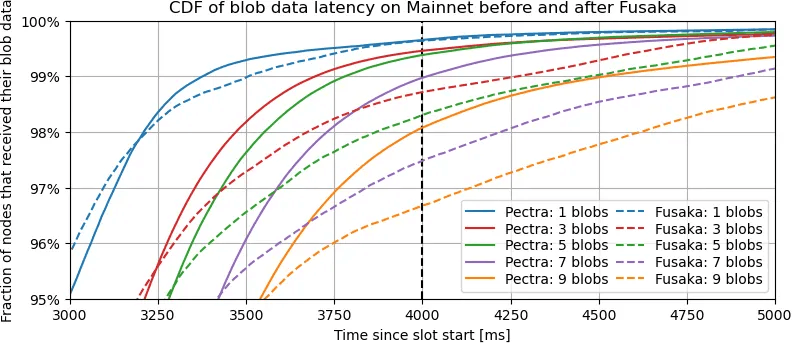
Description. These two plots mimic the above plots but focus on the latencies for validators to receive enough blob data to validate blocks, i.e., all blobs for each block in Pectra compared to only the required blob columns in Fusaka. These plots do not consider block latencies, only blob column latencies.
Takeaways. These two plots confirm the previous deduction that most nodes receive blob data faster in Fusaka than in Pectra, that it is the opposite at the tail, for the unluckiest 5%, and that the trend worsens as the blob count increases.
Before PeerDAS
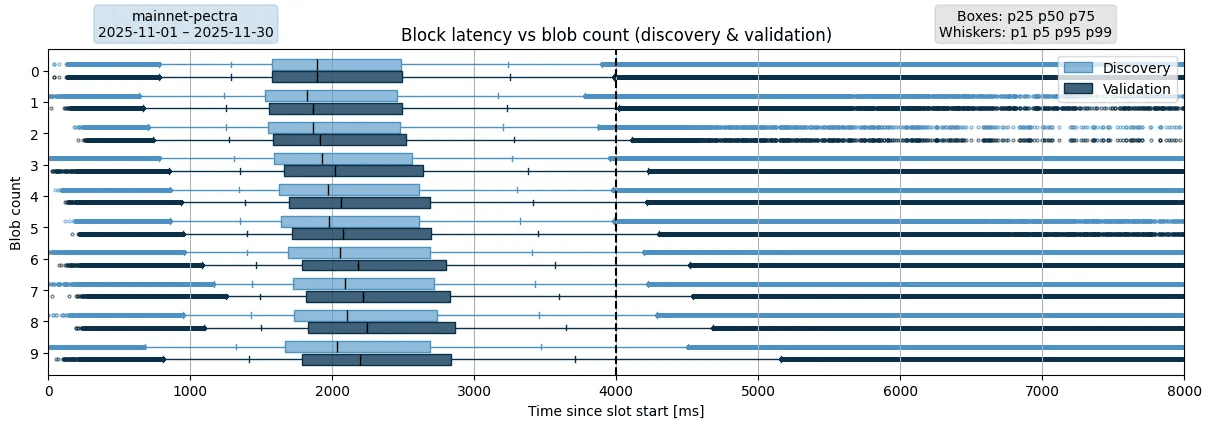
Description. This plot shows the distribution of block discovery & validation latencies on Mainnet under Pectra (before PeerDAS) depending on the number of blobs referenced in each block. As mentioned above, Pectra requires validators to download all blob sidecars referenced in a block in order to validate it. That latency is visible in the difference between discovery and validation latencies. Each data point of the plot is a unique tuple: (receiving node, finalized block). Block latencies higher than 30s have been filtered out to remove obvious outliers. The dataset is aggregated over the whole month of November 2025. The black vertical line at the 4s mark indicates the block attestation deadline.
Takeaways. There is a clearly visible increasing trend for all metrics from p25 up to p99, indicating that a higher blob count leads to a higher block validation latency. The p99s are already at the 4s deadline for 0-1 blobs and are above that deadline for all blobs ≥ 2, yet the validators are expected to not only receive but also process the block and its associated blobs by that deadline.
With PeerDAS-BPO1
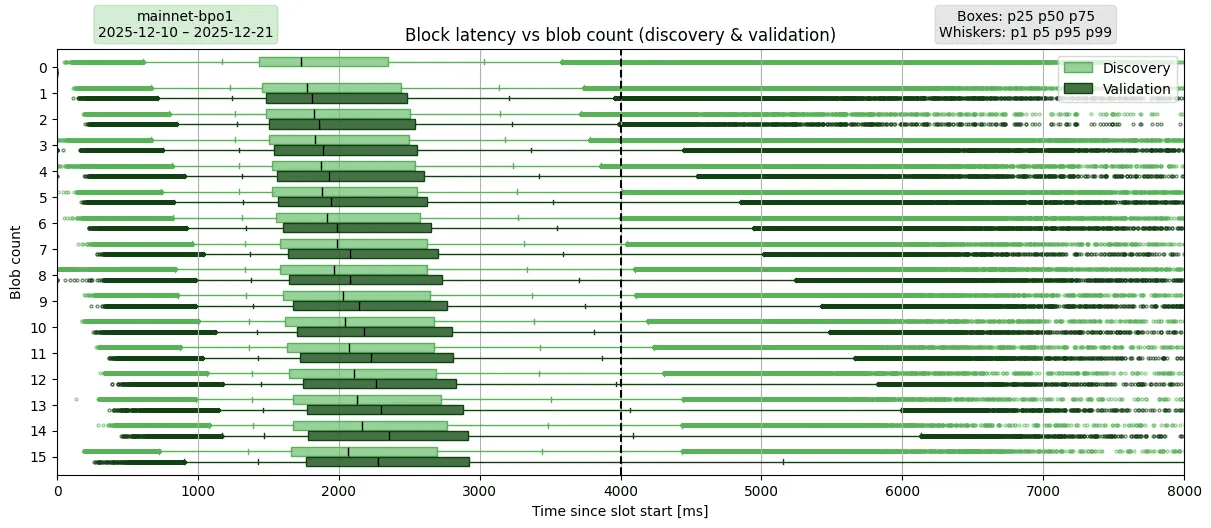
Description. This plot replicates the previous latency plot on Mainnet but after PeerDAS and BPO1 have been deployed. In addition, it shows the block discovery latency, as the first box for every level. This makes the added latency purely from blob column propagation more clear.
As mentioned above, the validation rules for Fusaka are different and require a validator to not download full blobs but instead at least 8 blob columns, including all the blob columns it requires to custody. The 11-day sampling period ranges from 2025-12-10 00:00 UTC, soon after the activation of BPO1, to 2025-12-21 23:59 UTC.
Takeaways. The trend appears similar pre- and post-PeerDAS from p5 to p99. Interestingly, p50 values are overall improved by 100-200ms post-PeerDAS, but p99 values are worse for blob count ≥ 3, implying a lower quality of service experienced by the unluckiest 1% of validators. The p99 values are all greater than 5s for blob count ≥ 9, reaching 6.1 s for 14 blobs and even 12.4 s for the max blob count of 15.
Latency on Hoodi with PeerDAS-BPO2
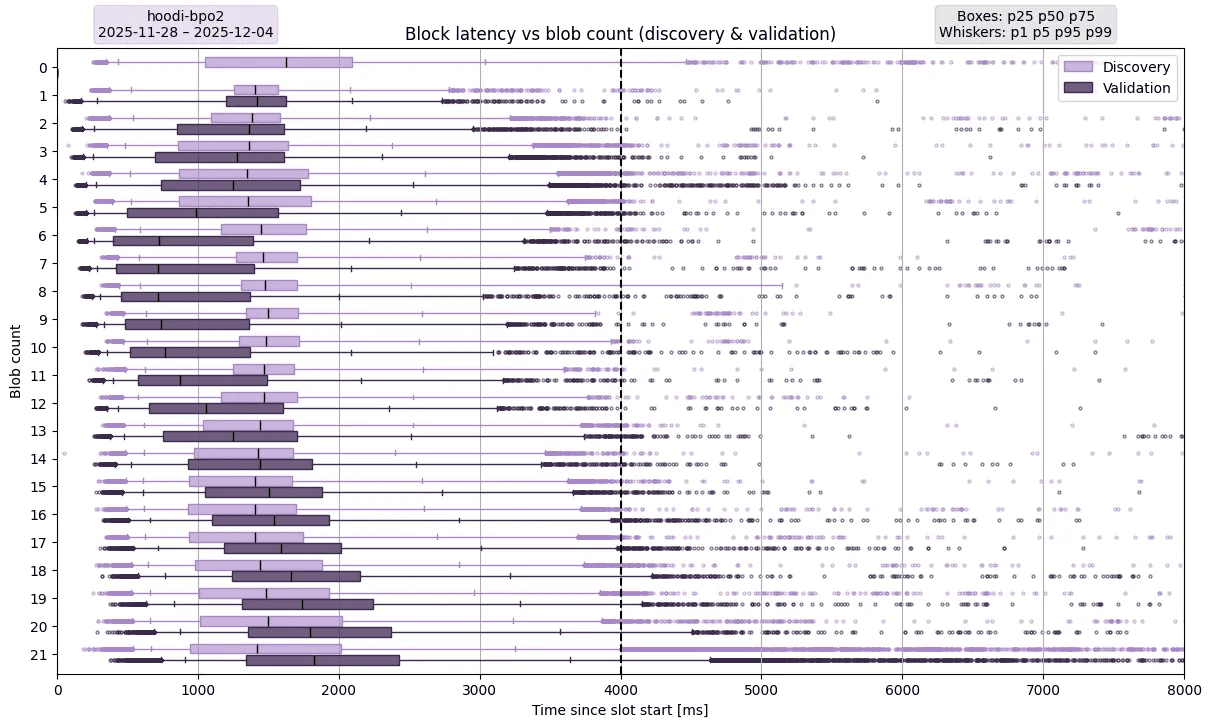
Description. This plot depicts block validation latency on Hoodi once
PeerDAS and BPO2 have been deployed. BPO2 has been deployed on 2025-11-12 on
Hoodi and raised the blob count to (target, max) of (14, 21). The data used
for this plot has been sampled over 7 days, from 2025-11-28 00:00:00 UTC to
2025-12-04 00:00:00 UTC, compared to a month for Mainnet because of the much
higher volatility observed on the Hoodi testnet.
Takeaways. The impact of blob count on block latency is not as clear on Hoodi as it is on Mainnet. There is a clear increasing trend that appears mostly linear for blob count ≥ 9 for all p1 to p99 values. We observed that a lot of nodes were not receiving enough blob columns to verify blocks, hence artificially reducing the overall latency because only successful validations are taken into account in the plot.
Attestation Rates
Mainnet before PeerDAS
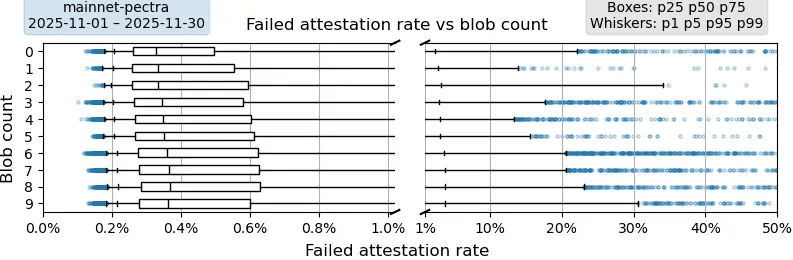
Description. This plot shows the fraction of validators that never attested to a block depending on the number of blobs in that block. Each data point corresponds to a finalized block. For instance, a p99 of 30% means that 1% of the blocks are attested by only 70% of the validators. The data is aggregated over the whole month of November 2025 on Mainnet. The x-axis of the plot is split into two linear axes of different scales to improve the readability of both boxes and whiskers.
Takeaways. There is a very light increasing trend on the median and a more visible trend on p99 for blob count ≥ 4. The p75 values are all close to or below 0.6% of failed attestation rate, which indicates a stable network even for a blob count of 9.
Mainnet with PeerDAS-BPO1
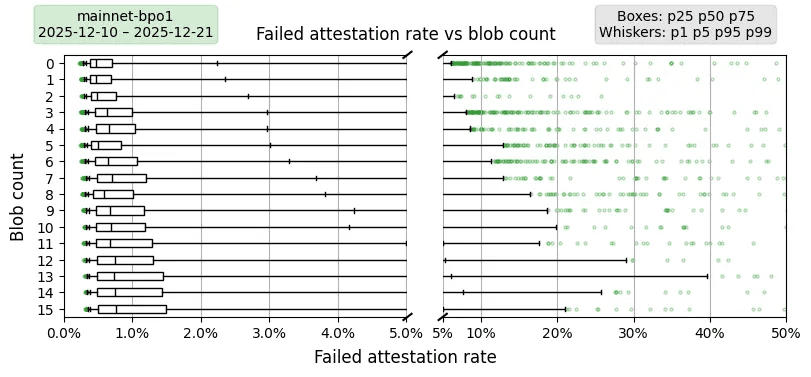
Description. This plot replicates the above attestation rate on Mainnet but after PeerDAS is activated and up until BPO1 activation. The plot is similarly split in two for readability.
Takeaways. Most importantly, the attestation rate overall worsens: p75 before PeerDAS hovers around 0.6% of failed attestation rate while it goes from 0.9% to 1.8% as the blob count increases once PeerDAS activates. All measurements from p50 up to p99 depict a similar trend: blocks have worse attestation rates as the blob count increases. The attestation rate is much more impacted by the blob count in this plot, with PeerDAS, than in the previous plot, without PeerDAS.
Hoodi with PeerDAS-BPO2
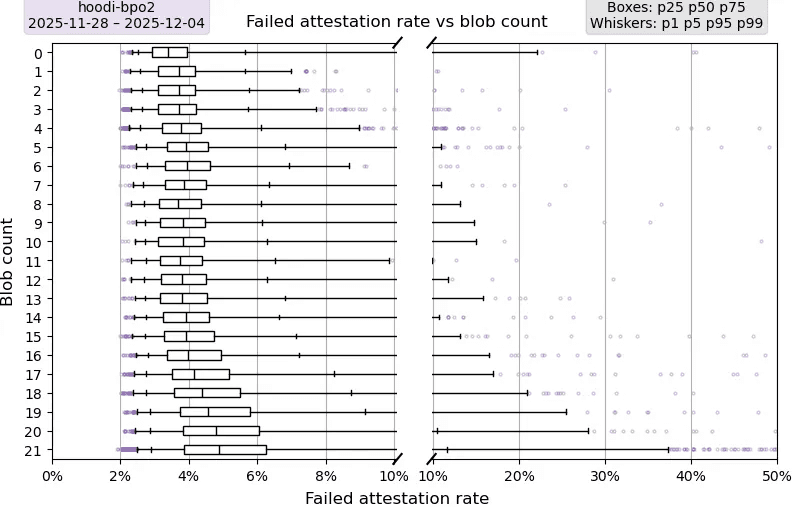
Description. This plot replicates the above plot on attestation rate but on Hoodi with BPO2 activated. The data has only been sampled over a week because of the much higher volatility observed Hoodi compared to Mainnet; in some cases, increasing the sample size increases the presence of outliers.
Takeaways. There is a clear increasing trend starting at 12 blobs where all measures above p25 visibly worsen as blob count increases. Additionally, p99 worsen across the board as the blob count increases. Compared to Mainnet before PeerDAS and its p75 below 1%, the p75 is much worse on Hoodi with PeerDAS and ranges between 5% and 7% instead.
Orphan Block Rates
Mainnet before PeerDAS
Absolute
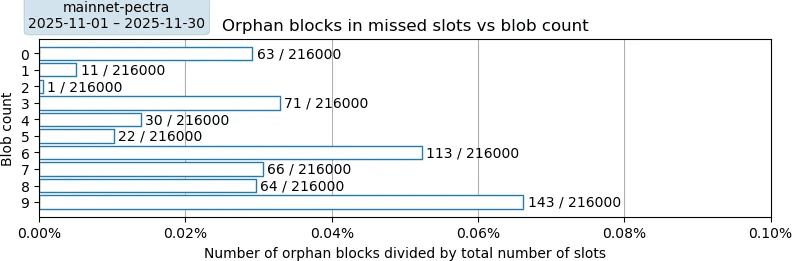
Description. This plot depicts the orphan block rate categorized by the number of blobs referenced in these blocks. These orphan blocks have been created by the expected proposer of their respective slots but, for unspecified reasons, did not end in the finalized chain of blocks. These rates are computed proportional to the total number of slots in the sampling period: 216,000 slots in November 2025.
Takeaways. The overall orphan rate is low at 584 / 216000 = 0.27%, which indicates an “uptime” of 99.73% for Ethereum. We observe two patterns in this plot. First, a pattern appears to repeat every 3 rows where a high value for a row is followed by two lower values: 63 orphans for 0 blobs followed by 11 and 1 orphans for the next two rows, 71 orphans for 3 blobs followed by 30 and 22 orphans for the next rows, and similarly for 6-9 blobs. The second pattern shows that increasing the blob count increases the orphan rate but only once we consider the first pattern. The increasing trend is clear when only observing blob counts of 0, 3, 6, and 9. The confidence in this second interpretation is lowered due to our inability to explain the first pattern.
Proportional
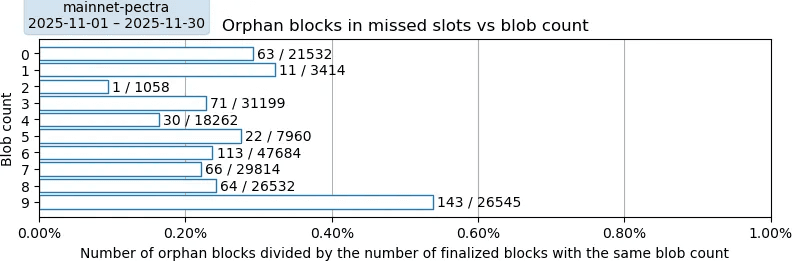
Description. This plot replicates the above absolute orphan rate plot but changes the divisors used in the rate computation. This plot shows “proportional” rates in that they are based on the number of finalized blocks that have the same blob count as the orphan blocks.
Takeaways. We mainly observe a diverse distribution of blob count in finalized blocks (the divisors in the fraction next to the bars) and two outliers at 2 and 9 blobs. With outliers ignored, the blob count does not appear to impact the orphan rate, unlike in the plot showing absolute orphan rate.
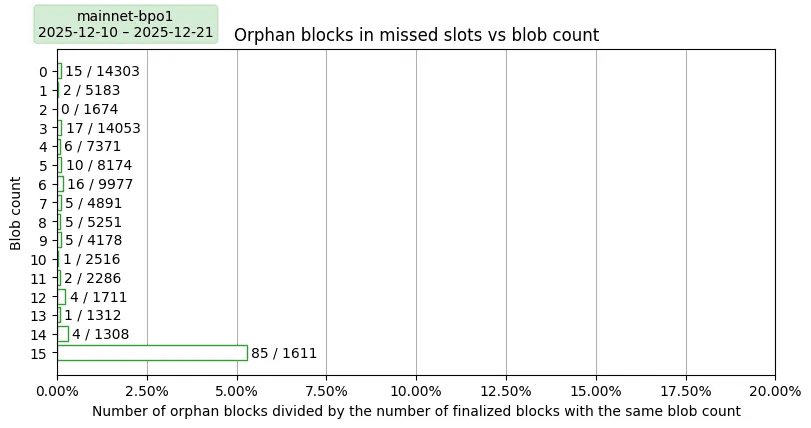
Mainnet with PeerDAS-BPO1
It would take several weeks to gather enough data to generate a plot for Mainnet post-Fusaka. For comparison, the above plot showing orphan blocks on Mainnet before PeerDAS depicts a small amount of orphan rate despite being computed over a whole month. The data below shows a very small number of observations for the higher blob counts, so is not indicative. The 15 blob outliers do stand out with an orphan rate of >5%.
Hoodi with PeerDAS-BPO2
Absolute
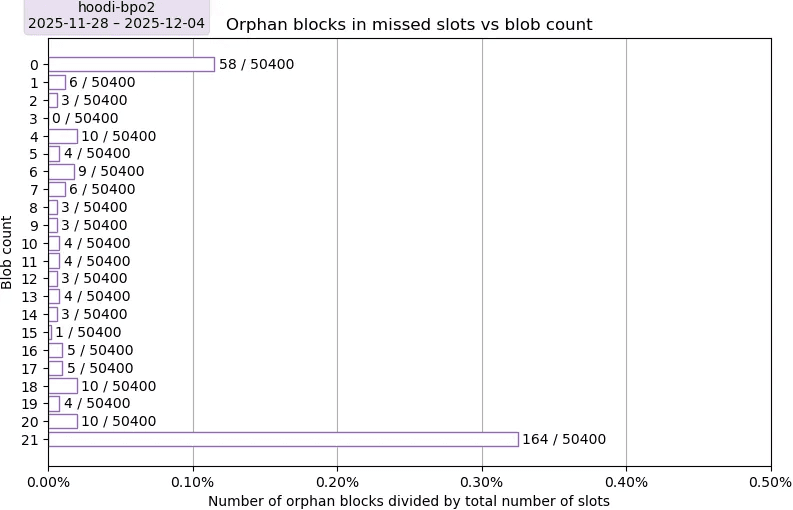
Description. This plot depicts the rate of orphan blocks on Hoodi as a fraction of the total number of slots in the sampling period: 50,400 slots in 7 days.
Takeaways. The overall orphan rate over the sampling period is low at 319 / 50400 (orphans / total slots) = 0.63%, which is marginally higher than the 0.27% of Mainnet. There are two clear outliers, for 0 blobs and 21 blobs, and there does not appear to be any clear trend indicating an impact of the blob count on the rate of orphan blocks in Hoodi.
Proportional
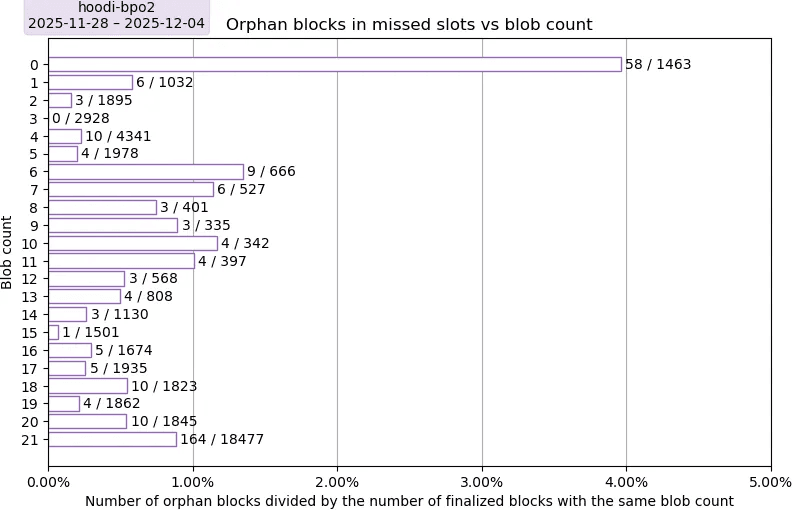
Description. This plot shows the rate of orphan blocks on Hoodi over a week as a fraction of the number of finalized blocks that have the same blob count.
Takeaways. There is a notable surge of the orphan rate between 6 and 13 blobs; we have no explanation for this event. The value for 0 blobs is a clear outlier, and the value for 21 blobs can be treated as an outlier due to very high divisor, between 4 and 46x larger than for other blob counts. Once the last row of 21 blobs is discarded as an outlier, there is no clear trend indicating a correlation between blob count and rate of orphan blocks.
Related Studies
- 2024-11: Pre-PeerDAS data showing a trend between block+blob sizes and delivery latencies [post]
- 2025-09: Ethpandas BPO report on safety/timely delivery of blobs on Fusaka devnet 5 with up to 30-50 blobs but with a small dataset [post]
- 2025-09: EF’s detailed attestation timings analysis in the post studying the feasibility of 6-second slots [post]
- 2025-10: Ethpandas report on up/down bandwidth consumption for various types of nodes on Fusaka devnet 5 [post]
- Lots of reports with analyses from Sunnyside Labs
[reports]
- 2025-10-10 [report] that complements the Ethpandas BPO report [post]: The number of missed attestation deadlines (the opposite of the “head correctness” metric in the reports) goes up to more than 50% for full nodes as the blob count increases from 10 to 40. Super nodes are mostly fine. The p75 latency for 50-60 blobs per block reaches 3 s so the tail is much higher (unclear in reports). Sampled columns are hard to get with 60+ blobs per block, likely due to network contention: too much bandwidth is required for the execution client and the consensus client struggles to respond to column requests.
- 2025-09-30 [report]: Fusaka devnet 5 with 1,700 nodes (1/8 of mainnet): The bottleneck for high blob count is the full node uplink due to the high number of blobs in the mempool (execution client), while the bandwidth for super nodes is mostly in sampled columns (consensus client).
- 2025-07-14 [report]: Appendix B for list of Grafana dashboards, Appendix D for some simple avg+max bandwidth on nodes when increasing blob count.
🌱 Proposal: Seeding network
As highlighted in the analysis, PeerDAS negatively impacts a number of measurements related to consensus stability, especially at the tail. On its own, for small bumps in blob counts with upcoming BPO’s, this shouldn’t be cause for alarm. However, in the PBS supply chain, milliseconds matter. Relays offer services for validators to delay committing to a block for as long as possible, to maximize MEV (timing games). This works because as of today, the latency penalty for including blobs is relatively minimal. As we’ve seen above however, that’s already changing, which may lead some entities in the PBS supply chain to impose artificial ceilings on the blob limit that are way below the actual limit. This would counteract the DA scaling benefits that are PeerDAS’ main raison d'être.
What. Because of this, we propose to build a global network of supernodes whose only task is to accelerate the propagation of data (blocks and blobs) from the block originator (relay in PBS) to the rest of the network. We expect the seeding network to reliably reduce and stabilize the latency experienced by validators by reducing and bounding the number of communication hops required to disseminate data to most validators. It will additionally improve blob usage efficiency by ensuring that builders can reliably include the economically optimal number of blobs without any additional latency penalties.
The concept of seeding network is aligned with the Rainbow staking framework (albeit out of protocol) as it relies on more powerful supernodes to contribute more to the network than regular nodes, ultimately improving the quality of service for everyone. These supernodes extend the idea of DAS providers as described in the original PeerDAS post. A couple of designs have proposed for PBS relays to become DAS providers and to offer an RPC service that validators can query to obtain samples. We propose to extend these designs with an additional support for GossipSub in order for supernodes to proactively accelerate data dissemination instead of only being passive actors waiting for client queries.
How. This seeding network will be composed of highly performant and highly
connected supernodes that will act as network hubs in order to deliver as much
data to as many nodes as possible. Supernodes will contribute to the
dissemination of block and blob columns by subscribing to the GossipSub topics
used for blocks (beacon_block) and for the 128 blob column subnets
(data_column_sidecar_[0-127]). Additionally, supernodes will reply to the
relevant RPC requests for blocks, blobs and blob columns, e.g.,
BeaconBlocksByRoot, BlobSidecarsByRoot, DataColumnSidecarsByRange.
The inter-supernode connections will be implemented the battle-tested, highly performant https://github.com/chainbound/msg-rs that powered our low-latency mempool service Fiber. The geographical placement of each supernode and the topology of the network will be designed to minimize overall dissemination and request latencies for the validators, ensuring proper distribution in hotspots such as Virginia, Frankfurt and Tokyo.
Expected Metric Improvements
We expect the seeding network to have clear improvements on the Ethereum network in terms of:
- Block and blob reception latency: A small network of high-performance supernodes enables dissemination with fewer hops than a larger and more heterogeneous network does.
- Attestation rate and orphan block rate: Thanks to a faster dissemination of both blocks and blob columns, validators will be able to attest blocks faster, hence reducing the probability that blocks fail to be attested in time and end up as unproductive orphans instead of being part of the finalized chain.
- Reduction of strategic blob limiting in PBS: Because of the above 2 improvements, the benefits of strategic (lower) blob inclusion in the PBS supply chain are nullified.
Acknowledgments
We thank the ethPandaOps team for giving us access to and helping us with the Xatu databases, as well as the Xatu contributors for populating Xatu with data for us to analyze. We also thank the authors of the “Multiple Sides of 36 Coins” blockchain network analysis published at SIGMETRICS 2026 [arXiv version], and particularly Lucianna Kiffer, for sharing updated numbers on the sizes of various Ethereum networks.
next reads
Keep the thread going with related posts.
Attested TLS in the Wild
An exploration of attested TLS for fully confidential, end-to-end attested TEE communication
Vixy: Vibe-coding an Ethereum Node Proxy
An experiment in using Claude Opus 4.5 to one-shot a production-ready Ethereum EL and CL JSON-RPC proxy with automatic failover.
FlowProxy: Approaching Optimality
Our second collaboration with Flashbots on FlowProxy, featuring network analysis of bundle losses and latencies, plus transport layer optimizations for BuilderNet.